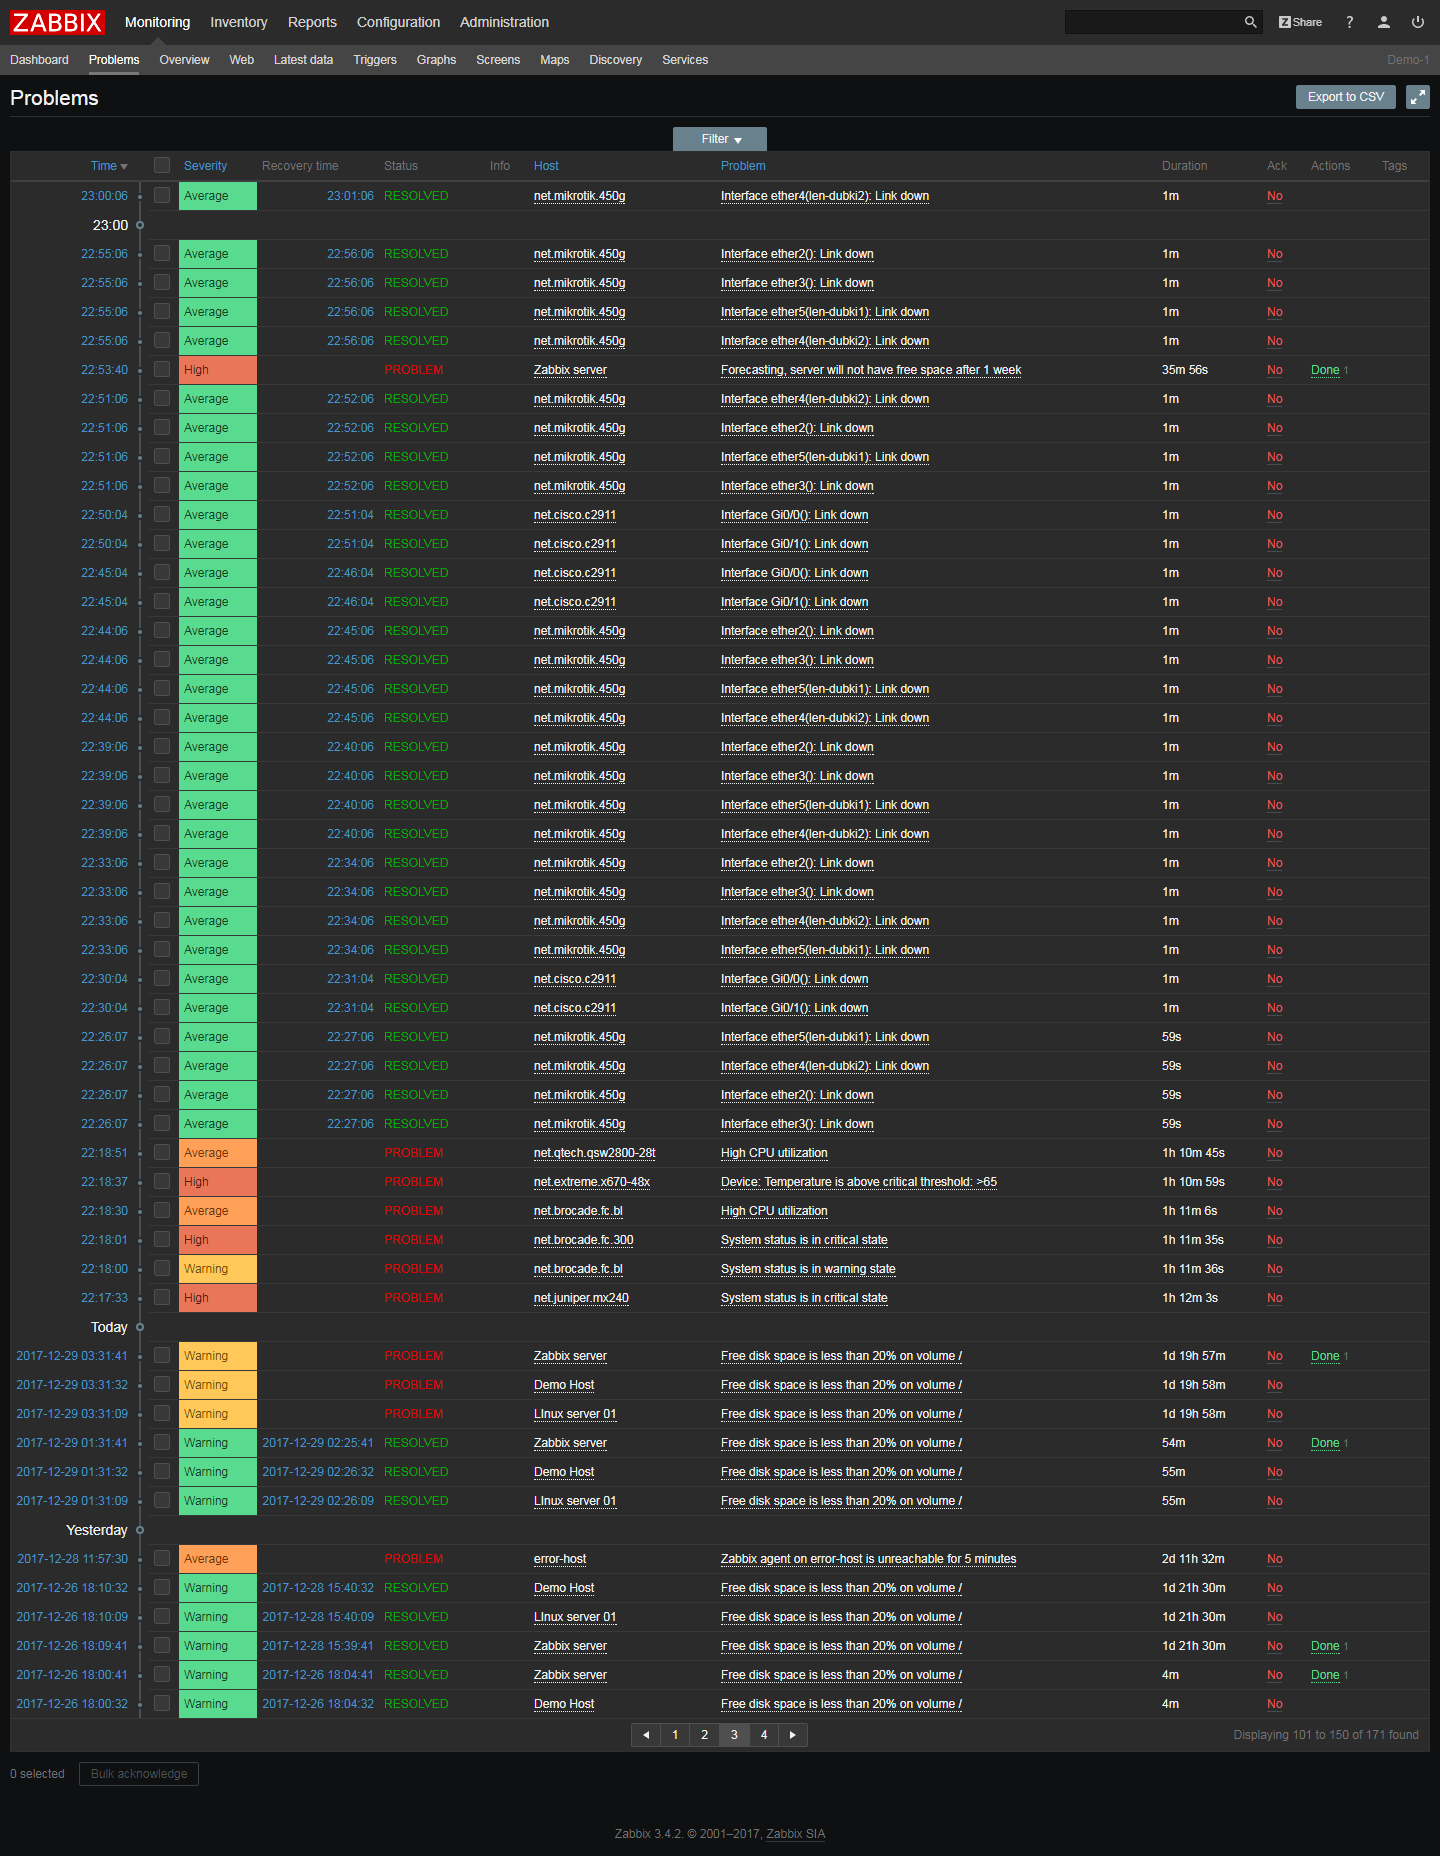
Monitor any possible server performance metrics and incidents:

Server performance
- High CPU or memory utilization
- Network bandwidth usage
- Packet loss rate
- Interface error rate
- Number of tcp connections is anomaly high for this day of the week
- Aggregate throughput of core routers is low
Server availability
- Free disk space is low
- System status is in warning/critical state
- Device temperature is too high / too low
- Power supply is in critical state
- Fan is in critical state
- No SNMP data collection
- Network connection is down
Configuration changes
- New components added or removed
- Network module is added, removed or replaced
- Firmware has been upgraded
- Device serial number has changed
- Interface has changed to lower speed or half-duplex mode
This is a sample list of server-related metrics and incidents, monitored by Zabbix out of the box. See the full list in template descriptions. You can extend/change the scope of monitored objects by adding new items, writing custom data collection scripts, building custom templates, etc.
Use out-of-the-box templates to monitor all popular servers & OS:


Out-of-the-box templates come with preconfigured items, triggers, graphs, applications, screens, low-level discovery rules, web scenarios, etc.
More templates:

Zabbix Integrations:
zabbix.com/integrations

Community templates:
github.com/zabbix/community-templates

Get help from Zabbix team:
Template Building Services
Zabbix features and benefits

Various data collection methods and protocols
- SNMP, IPMI
- Active / Passive modes
- IPv6 support
Flexible and extendable data gathering
- Calculated and aggregated metrics. For example: sum of traffic between two ports on a network switch.
- Preprocess collected data. For example: use regexp to extract some specific metric from legacy device.
Autodiscovery
- Autodetect network devices. For example: new switch added, replaced or removed.
- Autodetect device configuration changes. For example: new network modules added, or replaced; firmware upgraded.
Templating
- Start to monitor all metrics instantly by using out-of-the-box templates
- Clone and mass-update thousands of similar network devices using device configuration templates

Flexible trigger expressions
- Create complex logical expressions regarding monitored statistics of network devices
- Avoid false positives by defining hysteresis
Trigger dependencies
- Define multi-level dependencies between related network nodes. Detect root cause failures.
Proactive network monitoring
Problem severity levels
- Define trigger severity levels to help concentrate on most important problems in case of multiple network issues.

Flexible notifications
- Multiple delivery methods: email, sms, jabber, custom scripts or messenger
- Customize message content based on recipient
Remote command execution
- Custom scripts
- Run remote commands even behind firewalls
Event correlation
- Decrease notification noise with event correlation
Customized escalation scenarios
- Build flexible escalation scenarios

Integration with 3rd party software
- Helpdesks, ticketing systems
- Configuration management systems
- Messengers, mobile applications
Task automation
- Use API to automate configuration management
- Retrieve monitoring data
- Generate custom reports
Zabbix proxy
- Monitor remote servers even behind the firewalls
- Run remote commands behind firewalls
Optimized for high performance
- Scale endless by
- Scale by offloading central server
High Availability
- Buffer monitoring data even if Zabbix server is not available
- Build redundant monitoring solution using Zabbix components. See example.
Security and authentication
- Encrypt all monitoring traffic between Zabbix and your network devices
- Use LDAP authentication and flexible user permissions
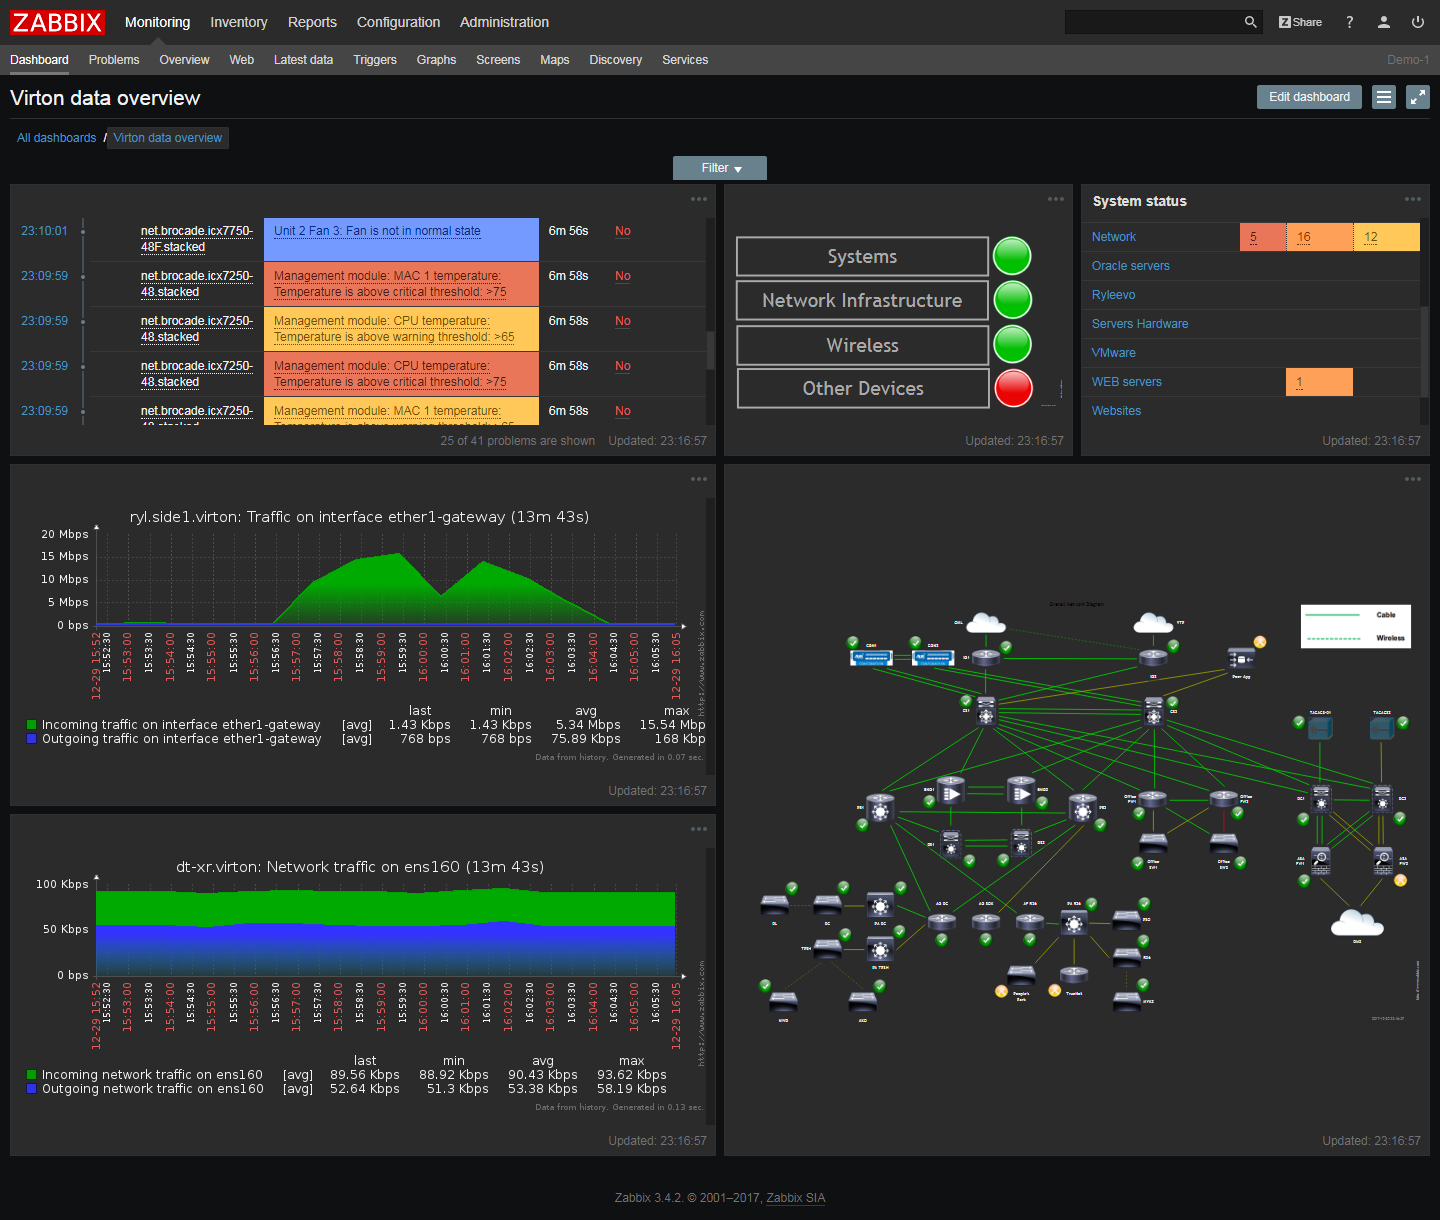
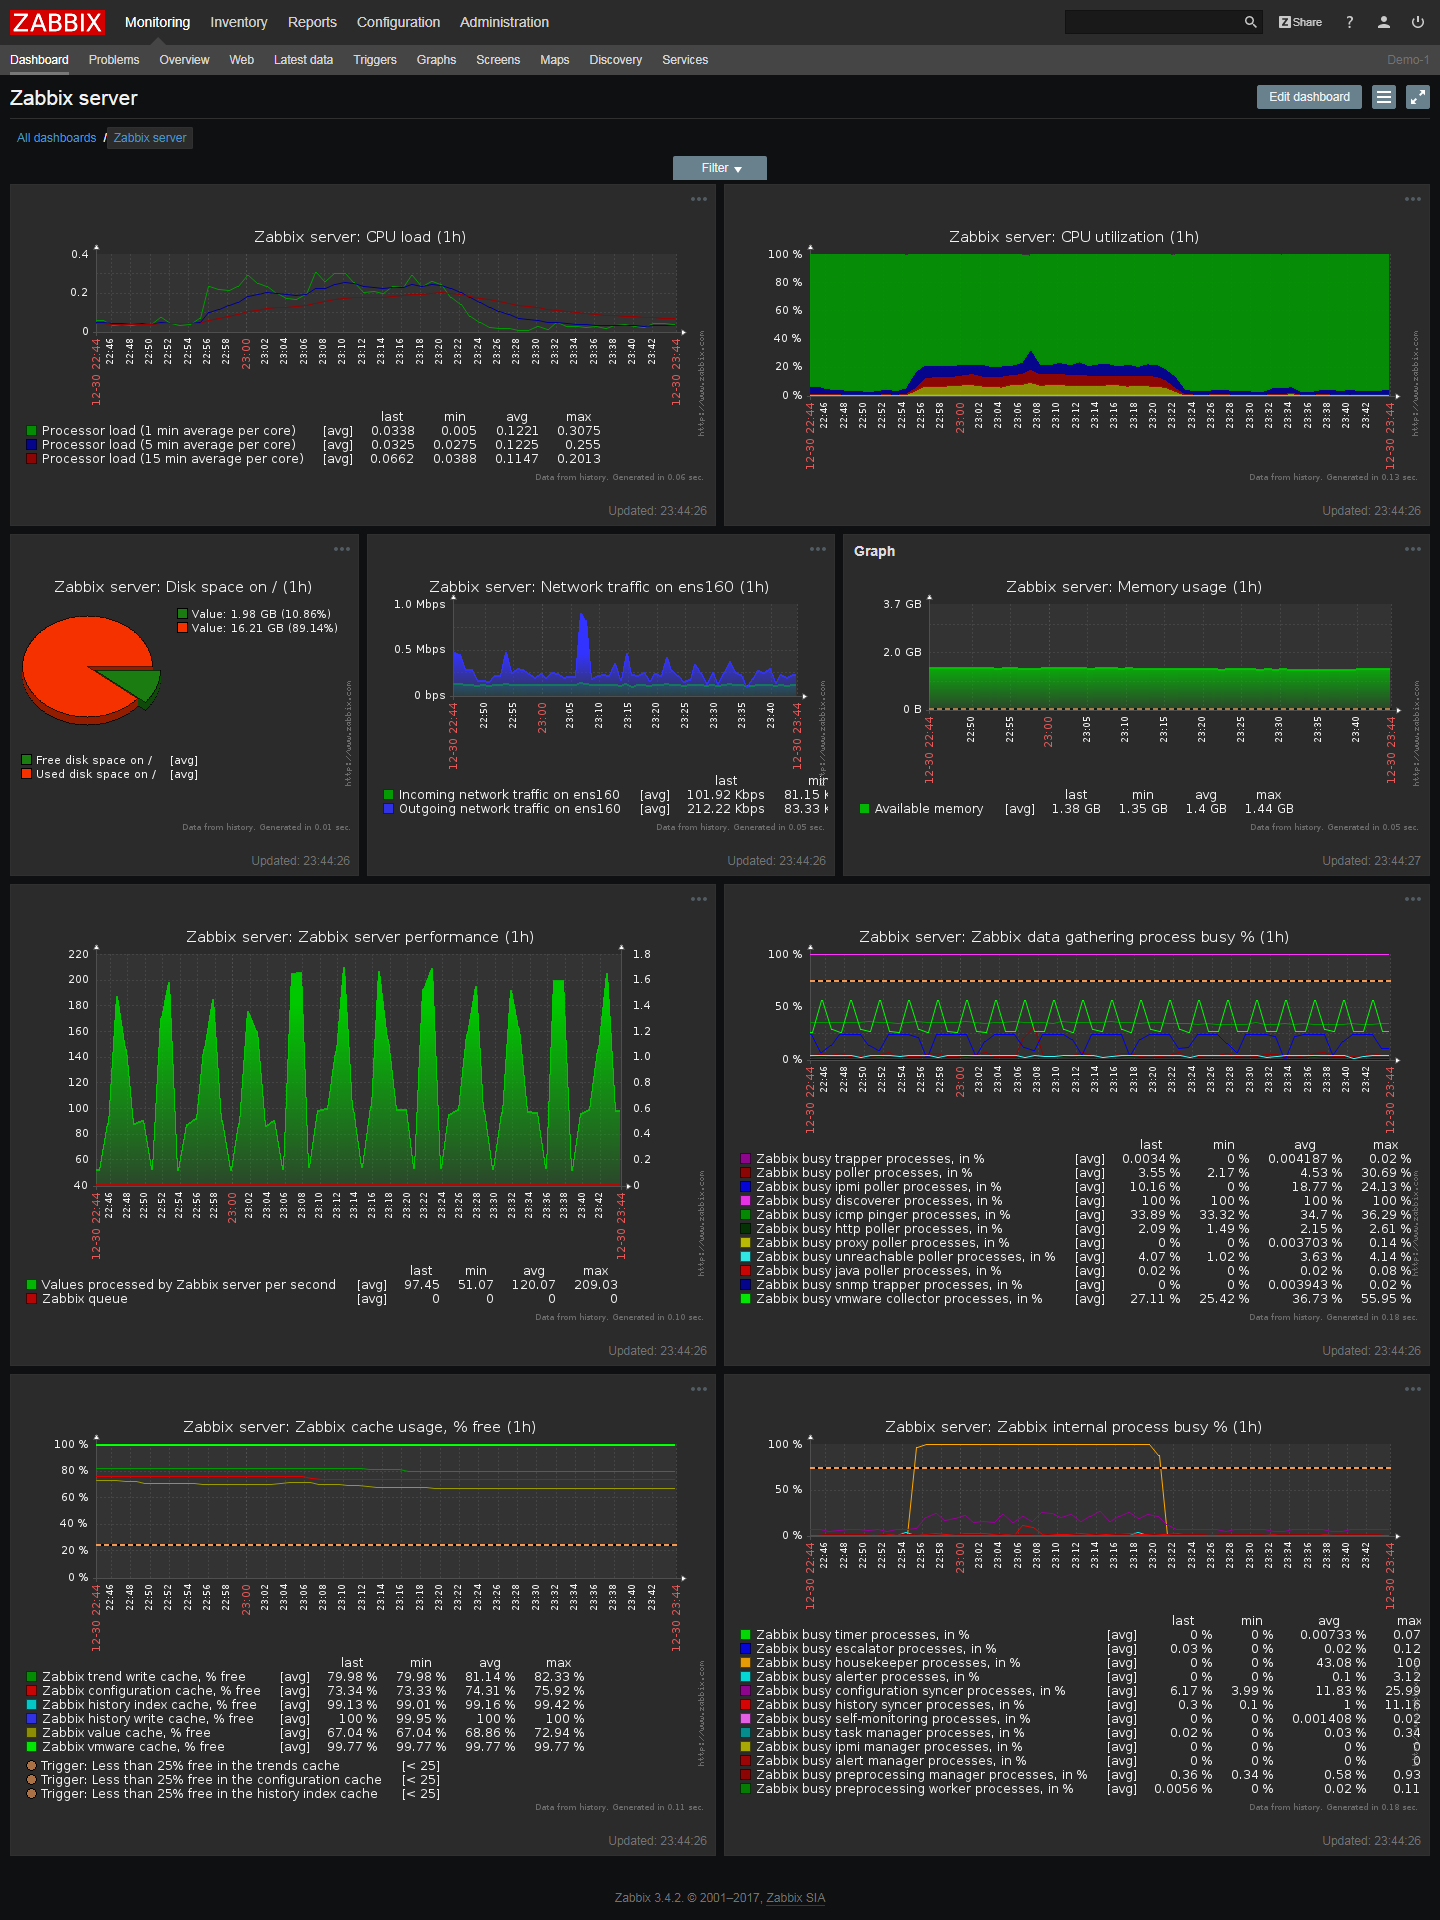
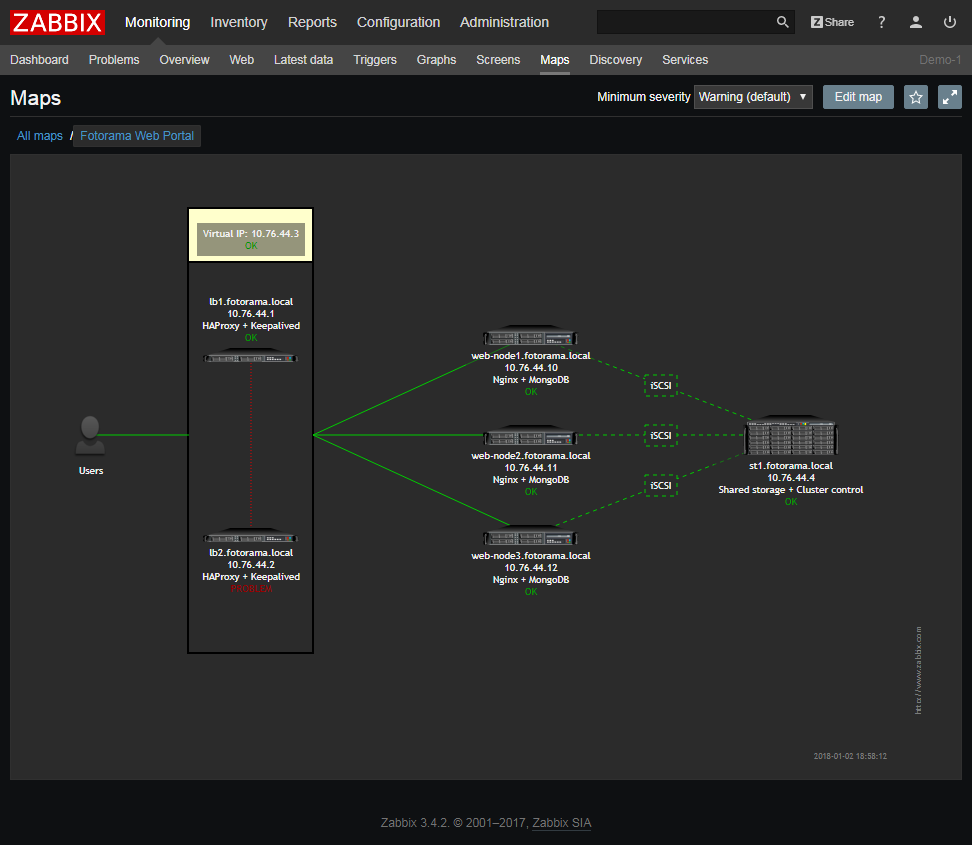
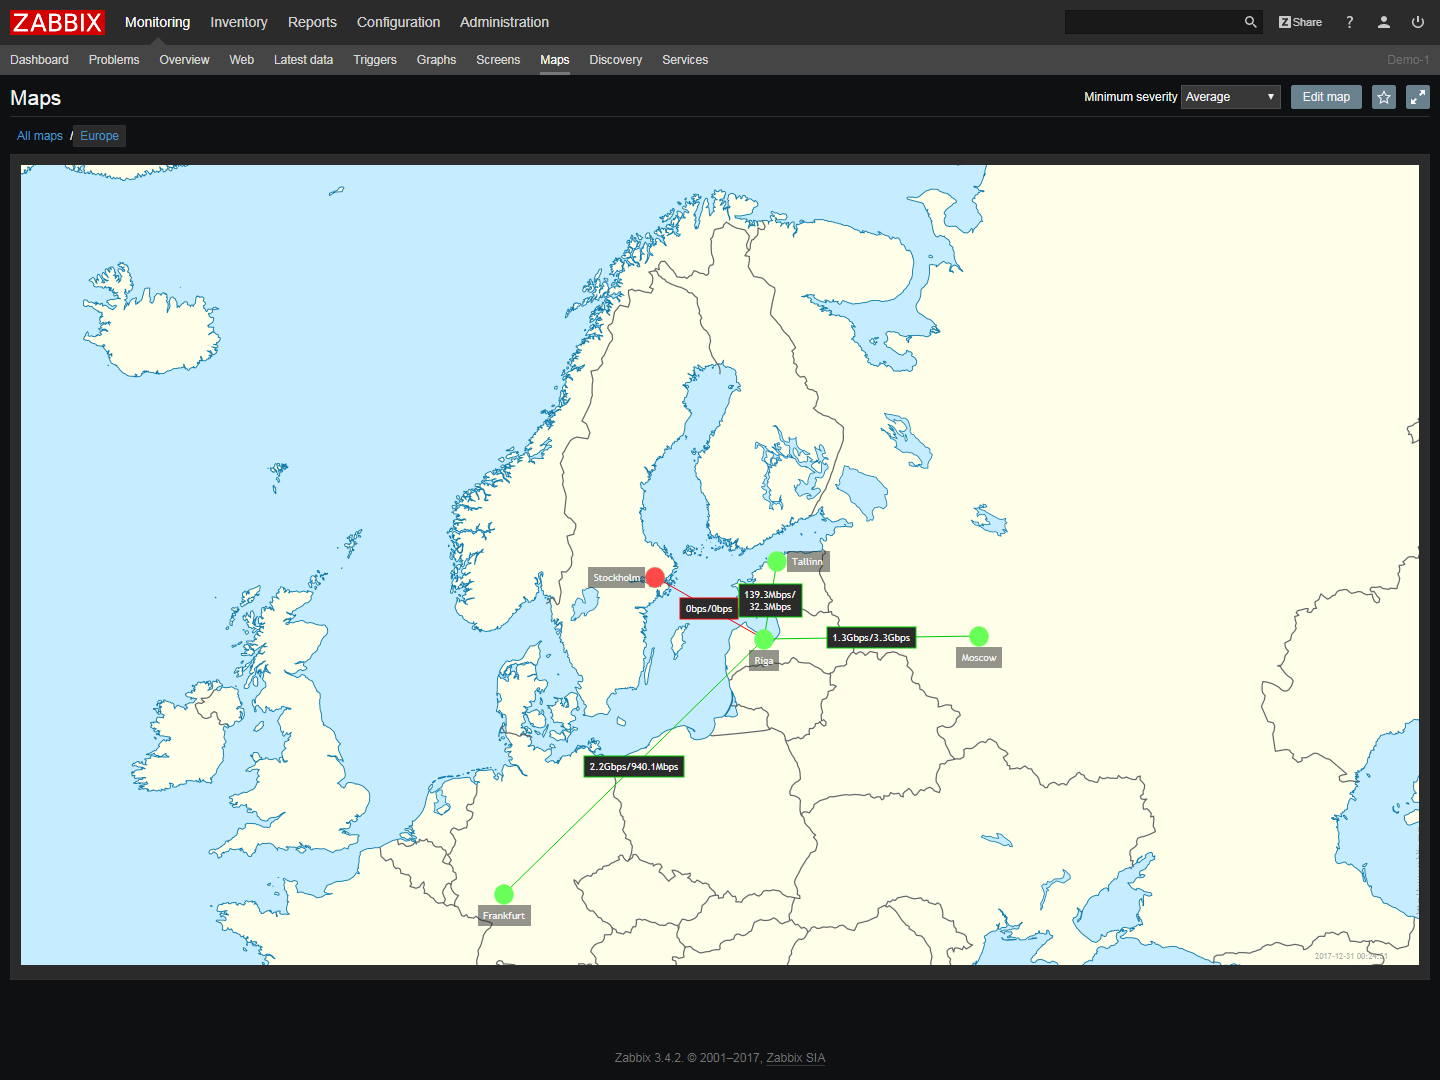
Visualize server performance and availability
Related case studies


4.4 out of 5 stars
(298 reviews)
(298 reviews)


4.3 out of 5 stars
(184 reviews)
(184 reviews)

8.3 out of 10 stars
(162 reviews)
(162 reviews)

4.3 out of 5 stars
(95 reviews)
(95 reviews)

4.7 out of 5 stars
(81 reviews)
(81 reviews)
Explore a quick technical overview
Start to monitor your servers in 10 minutes!
Download ZabbixZabbix is a professionally developed open-source software with no limits or hidden costs.